You are not looking for the slowest statement, since it is not necessarily noticeable from a system point of view. From a system point of view, a statement executing 1000 times per minute taking 200ms is more interesting than a statement executing 1 time per minute taking 10 seconds.

The Profiler trace for this task is quite simple.
- Start SQL Server Profiler
- Start a new trace with your SQL Server instance as the source
- Check the Save to table option and provide a location for the trace table. I have called the trace table t, but you can use any name.
- Check the Set maximum rows and enter a number <=100000
- In the Events Selection tab, uncheck all events. This window is a bit annoying, since you can't resize it.
- Check the SP:Statement Completed event under Stored Procedures. This is the only event you will need. To see it, you might need to check the Show all events box.
- Check the Show all columns box, and select the columns you want. At this point you only really need databasename, objectname, textdata, duration, cpu, reads, writes, linenumber, rowcounts and SPID. However, applicationname, NTUsername and endtime can be useful too.
- Click Run
- You will be able to see how many records are being collected, and can stop the trace manually at any time.
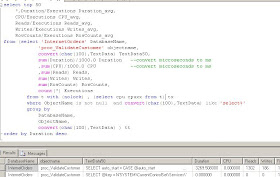
- Once the trace has stopped (or you have stopped it) run the following query to get the top 50 statements by their combined duration.
select top 50 *,Duration/Executions Duration_avg, CPU/Executions CPU_avg, Reads/Executions Reads_avg, Writes/Executions Writes_avg, RowCounts/Executions RowCounts_avg from (select DatabaseName, objectname, convert(char(100),TextData) TextData50, sum(Duration)/1000.0 Duration,sum(CPU)/1000.0 CPU,sum(Reads) Reads, sum(Writes) Writes, sum(RowCounts) RowCounts, count(*) Executions from t with (nolock) where ObjectName is not null group by DatabaseName, ObjectName, convert(char(100),TextData) ) t order by Duration desc

Now comes the fun task of tuning the individual queries. Starting with the top query, open up the stored procedure, and look at the particular statement in the context of the procedure. Is there a way to improve this particular statement, or can the structure of the procedure be improved? The answer is invariably Yes, although you want to find improvements that can be introduced with minimal disruption.
A couple of notes
- Try to avoid running Profiler on the server itself. That will add more work to the server.
- I like to alter the trace table, removing unnecessary columns, changing nvarchar to varchar, ntext to varchar(max) to reduce the size of the table, which will make subsequent queries faster.
- You can ask Profiler to group the data, but since you will be aggregating the data in SQL there is no need.
- Run the profiler trace during a busy, but not critical, time.
- Earlier versions of SQL profiler could make SQL Server unstable, if you collected too many records. This isn't such an issue now, but I encourage you to always limit the number of event records so that you minimise the database server impact.
- The overhead on the server is mostly the cost of the Profiler application (that's why you should run the app on a machine that isn't the database server) and inserting the event records into SQL Server (which is why you should target a non production server for the trace records)
- On a very busy system, where you do not want to trace every statement, try a filter on reads. For example, you might only record events with more than 10 reads (these aren't physical reads). The logic being that a statement looking at less than n pages, is unlikely to be a big resource consumer.
- Start the exercise with a small record limit, and look at the results. You might want to add some additional filters to exclude/include certain application components.
- Keep a summary of the trace output. After you have tuned the top queries, you will be able to measure the improvements. I don't think you need to keep the atomic trace records.
- Profiler will show duration in milliseconds, althought it is saving the data in microseconds. The trace table will have duration in microseconds. Don't be confused.
- I will often not ask Profiler to save to a trace table while tracing. Once I have the records I want, I then ask Profiler to save to a trace table.
- If you are going to repeat this exercise, you should save the trace template. That will help you avoid defining the events, columns and filters again.
- The query above orders by duration. You might also like to order by reads, cpu or writes. This would be particularly appropriate where your system has parallelism enabled. With parallelism a query with a 500ms duration might be consuming 4 seconds cpu. Having said that, in a high volume transaction system, it is generally not appropriate to have parallelism enabled. In a tp system, I would tend to disable parallelism by default, and turn it on for individual queries that need it, but that's another blog.
- This exercise is just looking at stored procedure statements. This trace exercise will not include statements that are not part of a procedure.
Also note, the Profiler can trace so much information. The more you know about Profiler, the more it will help you diagnosing performance and functional issues. This exercise is just one very narrow performance task Profiler can help you with.

No comments:
Post a Comment