Sometimes we need to create a CASE statement in an MDX calculation to split a measure value. There was a good example in this msdn forum. For a simple example
CASE
WHEN Measures.[MyCalc]=0 THEN 0
WHEN Measures.[MyCalc]<=5 THEN 5
WHEN Measures.[MyCalc]<=10 THEN 10
WHEN Measures.[MyCalc]<=15 THEN 15
WHEN Measures.[MyCalc]<=20 THEN 20
WHEN Measures.[MyCalc]<=25 THEN 25
...
ELSE 100
END
What I have found is that Measures.[MyCalc] is recalculated for every WHEN clause until it drops out. So the CASE statement could be rewritten as below with much greater performance. If your calculations are parsing through 20 WHEN clauses, this new expression could be 20 times faster! This is most noticeable when MyCalc is itself expensive, particularly when it is FE (formula engine) intensive.
CASE Round(Measures.[MyCalc]/5)*5
WHEN 0 THEN 0
WHEN 5 THEN 5
WHEN 10 THEN 10
WHEN 15 THEN 15
WHEN 20 THEN 20
WHEN 25 THEN 25
...
ELSE 100
END
Note; you cannot put < or > operators in the WHEN statements if you use the second format above. However, with a little arithmetic, you might be able to bracket the calculation as I have done above using Round().
Another note; if might not be possible to express the CASE statement as I suggest above because there are several conditions. However, I encourage you to think laterally, as you might be able to nest a few CASE statements on the various conditions, so there are fewer calcs per CASE statement, making perform much better.

Showing posts with label MDX. Show all posts
Showing posts with label MDX. Show all posts
Sunday, June 7, 2015


Saturday, June 6, 2015
Confusing = with IS in MDX calculations
This topic has been written about many times, perhaps even by me. However, it is a common pitfall, so I am writing about it again. See this msdn post for a recent example.
Essentially, the pitfall is when an author wants to check if the current member of a dimension attribute is at a particular member. The incorrect MDX might look like this
IIF(DimCustomer.CustomerClass.Currentmember = DimCustomer.CustomerClass.CustomerClass.&[Gold], Measures.Price*0.9,Measures.Price)
However, the "=" operator is actually testing if the tuples on either side are equal in their Measure. Since there is no Measure specified, the measure will be the one on that slice (tuple), or the default measure if there isn't one in the tuple. For the two tuples to be equal is rather random. So the results will be somewhat unpredictable.
What should be used is the "IS" operator, which will test if the members on either side are the same. That is; is the current CustomerClass Gold? So the IIF() should be rewritten as
IIF(DimCustomer.CustomerClass.Currentmember IS DimCustomer.CustomerClass.CustomerClass.&[Gold], Measures.Price*0.9,Measures.Price)
Note, if you are having problems following this logic, the IIF() with the IS operator is equivalent to the following statement.
IIF(DimCustomer.CustomerClass.Currentmember.properties("key") = "Gold", Measures.Price*0.9,Measures.Price)
Essentially, the pitfall is when an author wants to check if the current member of a dimension attribute is at a particular member. The incorrect MDX might look like this
IIF(DimCustomer.CustomerClass.Currentmember = DimCustomer.CustomerClass.CustomerClass.&[Gold], Measures.Price*0.9,Measures.Price)
However, the "=" operator is actually testing if the tuples on either side are equal in their Measure. Since there is no Measure specified, the measure will be the one on that slice (tuple), or the default measure if there isn't one in the tuple. For the two tuples to be equal is rather random. So the results will be somewhat unpredictable.
What should be used is the "IS" operator, which will test if the members on either side are the same. That is; is the current CustomerClass Gold? So the IIF() should be rewritten as
IIF(DimCustomer.CustomerClass.Currentmember IS DimCustomer.CustomerClass.CustomerClass.&[Gold], Measures.Price*0.9,Measures.Price)
Note, if you are having problems following this logic, the IIF() with the IS operator is equivalent to the following statement.
IIF(DimCustomer.CustomerClass.Currentmember.properties("key") = "Gold", Measures.Price*0.9,Measures.Price)
Thursday, January 24, 2013
MDX Running totals on a nested ordered set
I like MDX puzzles, and just got a good one today. The requirement was to have running totals over an ordered set, but the set was only ordered at the lowest level, and the running totals were just within the parent member. Ie, a list of countries and cities, where cities are ordered descending by [net sales] within country, and [profit] has a running total for the cities within that country.
As I have said before, anything is possible with MDX, and here is the solution for ordering cities within countries and having running totals of profit of cities within countries. I haven't ordered the countries here, but they could be independently ordered.
Essentially, what the query does is order the cities (along with city.All). For the running total it takes the members from the City.All member to the current member and aggregates them. Simple really.
 with
set OrderedCities as
[Geography].[Country].[Country]
*Order(Nonempty([Geography].[City].Members,[Measures].[Profit])
,[Measures].[Net Sales], DESC)
member [Measures].[CityRank] as rank(([Geography].[Country].CurrentMember,[Geography].[City].currentmember),OrderedCities)
member [Measures].[CountryRank] as rank(([Geography].[Country].CurrentMember,[Geography].[City].[All]),OrderedCities)
member [Measures].[ProfitRunningTotal] as
sum(
Topcount(OrderedCities-TopCount(OrderedCities, ([Measures].[CountryRank]))
,[Measures].[CityRank]-[Measures].[CountryRank])
,[Measures].[Profit])
select
{[Measures].[Net Sales]
,[Measures].[CityRank]
,[Measures].[CountryRank]
,[Measures].[Profit]
,[Measures].[ProfitRunningTotal]
} on columns,
OrderedCities on rows
from [MyCube]
As I have said before, anything is possible with MDX, and here is the solution for ordering cities within countries and having running totals of profit of cities within countries. I haven't ordered the countries here, but they could be independently ordered.
Essentially, what the query does is order the cities (along with city.All). For the running total it takes the members from the City.All member to the current member and aggregates them. Simple really.
 with
set OrderedCities as
[Geography].[Country].[Country]
*Order(Nonempty([Geography].[City].Members,[Measures].[Profit])
,[Measures].[Net Sales], DESC)
member [Measures].[CityRank] as rank(([Geography].[Country].CurrentMember,[Geography].[City].currentmember),OrderedCities)
member [Measures].[CountryRank] as rank(([Geography].[Country].CurrentMember,[Geography].[City].[All]),OrderedCities)
member [Measures].[ProfitRunningTotal] as
sum(
Topcount(OrderedCities-TopCount(OrderedCities, ([Measures].[CountryRank]))
,[Measures].[CityRank]-[Measures].[CountryRank])
,[Measures].[Profit])
select
{[Measures].[Net Sales]
,[Measures].[CityRank]
,[Measures].[CountryRank]
,[Measures].[Profit]
,[Measures].[ProfitRunningTotal]
} on columns,
OrderedCities on rows
from [MyCube]
Sunday, September 11, 2011
Why are there less data in the cube than the fact table?
Sereral customer have asked me why they have less data in their cube than they have in the fact table. Essentially, when they view the cube Measures.NetSales does not equal Sum(NetSales) from the fact table. So here are the some possible causes, that I would investigate in such circumstances.
- The measure datatype cannot hold the aggregated number. For example, the fact table might have an integer datatype for the SalesQuantity column, which might be fine for the SQL table. However, by default, SSAS will give the SalesQuantity measure the same datatype, but now it must be able to contain the sum(SalesQuantity). If sum(SalesQuantity) is greater than 2^31 SSAS will not display any errors, and the Measures.SalesQuantity will show numbers that appear to wrap around. So the numbers are much smaller than expected (almost random) at an aggregated level. The solution is simple, just change the datatype in the cube to a much larger number, for example bigint, which can be up to 2^63. One of the good things about using bigint over int, is that the cube is almost exactly the same size, as SSAS will compress the leading zeroes in binary numbers very effectively. If you need numbers larger than 2^63, you might need to use a double datatype, which, although potentially much larger is an imprecise number. Also, a double datatype measure, will typically make the cube significantly larger than a binary measure containing the same information.
- There are missing members on one or more dimensions and missing members are not enabled. The missing member facts will not be included in the cube. I personally believe the cube should contain all the facts in the fact able. Even if there is a missing member, the data should still be available. For example, if there are sales for a ProductId that does not exist, typically, you will still want to know about the sales even though you cannot say which product it was for. I prefer to enable missing members, and just hide them if you must. It is also a good practice to regularly check for missing members, either in the DW or in the cube (through missing members).
- The third situation where the cube numbers are light is an unusual one. It is where the fact table (actually a view) returns an arithmetic error such as divide by zero. Most times SSAS will sympathetically return the SQL error, and you will know there is a problem during cube processing. However, sometimes SSAS does not sympathetically return the SQL error, rather, it returns a successful cube process with the rows up until the divide by zero. There are two ways of locating this error. Firstly, you could simply execute the same SQL query in SQLEM window and wait for the full resultset or the arithmetic error to return. This is not practical in many circumstances due to the number of rows in the resultset. I guess you could get SSIS to help you, but an easier way is to use SQL Profiler and trace Error events.
- You have a referenced dimension and the INNER JOIN clause that SSAS is generating for SQL Server is removing fact records that don't join with the intermediate dimension. To identify this issue, you need to execute the SQL generated by SSAS, and compare its counts with the raw fact table.
- Is your cube (measure group) processed incrementally? If so, there might be a logic issue with the way you are incrementally processing. To verify, you could reprocess the entire measure group and see if the numbers now equal the fact table.
- Is the data in your fact table changing? Of course, if the fact table is changing, the MOLAP cube won't know about it. This can be related to incremental processing, where the incremental processing logic is good, but historic data records are changing. Strictly speaking you cannot incrementally process updates, only new records. If the data has changed, the cube (partition) will require processing.
- Have you a default member that is not the [All] mmeber, or do you have a dimension without an [All] member. In these cases, you would need to take this into account when comparing Measures.NetSales with sum(NetSales).
- The Calculate statement in the cube has been commented out.
- Use physical measures in the cube. Even if they are hidden, you can still query the physical measures.
- Ideally, start off by reconciling record counts. If you can, put a record count in the cube.
- When you are running SQL queries against the fact table, use the SQL statement that is generated by SSAS, since it might be referencing a different table/view than you expected. Also, as in point 4 above, it might be performing an INNER JOIN with an intermediate dimension that has missing members.
Wednesday, August 10, 2011
Improving MDX join performance
Analysis Services will tend to instantiate sets created from joins. Some sets can be extremely large and will actually fail with insufficient resources.
Server: The operation has been cancelled.
The solution is to write the MDX query in such a way that the intermediate sets are smaller. Here is an example of a problematic query that is asking for the top 10 hour/City/Date combinations. The output is simply 10 rows, but AS must create a set with hundreds of Millions of members to get the top 10.
select
[Measures].[Bytes Total] on Columns,
topcount(
[Client Host].[Client Geography].[City]
*[HoursOfDay].[HoursOfDay].[Hour Of Day]
*[Date].[Year Month Day].[Day]
,10,[Measures].[Bytes Total])
on Rows
from EasternMining
Here is a way to improve performance using the generate() function, another one of my favourite MDX functions.
select
[Measures].[Bytes Total] on Columns,
topcount(
generate([Client Host].[Client Geography].[City]
,{[Client Host].[Client Geography].currentmember}
*[HoursOfDay].[HoursOfDay].[Hour Of Day]
*[Date].[Year Month Day].[Day])
,10,[Measures].[Bytes Total])
on Rows
from EasternMining
The generate statement is breaking the query into a couple of steps, so that the largest set will probably be the Days*Hours, from which it is only keeping the top 10 for each city. The outside set, for every city, will only have 10 rows per city. The query is logically equivalent to the first query, meaning it will return the same results.
We could take this logic further with a second generate statement so the inside query only has 1o rows per city day combination.
select
[Measures].[Bytes Total] on Columns,
topcount(
generate([Client Host].[Client Geography].[City]
,topcount(
generate([HoursOfDay].[HoursOfDay].[Hour Of Day]
,topcount({[HoursOfDay].[HoursOfDay].currentmember}
*{[Client Host].[Client Geography].
currentmember}
*[Date].[Year Month Day].[Day]
,10,[Measures].[Bytes Total]))
,10,[Measures].[Bytes Total]))
,10,[Measures].[Bytes Total])
on Rows
from EasternMining
We can improve this query further by requesting nonempty() sets
select
[Measures].[Bytes Total] on Columns,
topcount(
generate(nonempty([Client Host].[Client Geography].[City],[Measures].[Bytes Total])
,topcount(
generate(nonempty([HoursOfDay].[HoursOfDay].[Hour Of Day],[Measures].[Bytes Total])
,topcount({[HoursOfDay].[HoursOfDay].currentmember}
*{[Client Host].[Client Geography].currentmember}
*nonempty([Date].[Year Month Day].[Day],[Measures].[Bytes Total])
,10,[Measures].[Bytes Total]))
,10,[Measures].[Bytes Total]))
,10,[Measures].[Bytes Total])
on Rows
from EasternMining
The NonEmpty() function is a very simple way to reduce the set size, and of course it can be done without using the generate() function. So going back to the original query, we might have found that the following change was sufficient to avoid resource errors.
select
[Measures].[Bytes Total] on Columns,
topcount(
nonempty(
[Client Host].[Client Geography].[City]
*[HoursOfDay].[HoursOfDay].[Hour Of Day]
*[Date].[Year Month Day].[Day]
,[Measures].[Bytes Total])
,10,[Measures].[Bytes Total])
on Rows
from EasternMining
However, I wanted to show the generate() function first, as it can improve the query in a way that the nonempty() cannot.
I should add that generate() and nonempty() functions are not panaceas for MDX query performance. The more you know MDX and the way SSAS executes the query, the more you will have in your toolkit to improve query performance.
Server: The operation has been cancelled.
The solution is to write the MDX query in such a way that the intermediate sets are smaller. Here is an example of a problematic query that is asking for the top 10 hour/City/Date combinations. The output is simply 10 rows, but AS must create a set with hundreds of Millions of members to get the top 10.
select
[Measures].[Bytes Total] on Columns,
topcount(
[Client Host].[Client Geography].[City]
*[HoursOfDay].[HoursOfDay].[Hour Of Day]
*[Date].[Year Month Day].[Day]
,10,[Measures].[Bytes Total])
on Rows
from EasternMining
Here is a way to improve performance using the generate() function, another one of my favourite MDX functions.
select
[Measures].[Bytes Total] on Columns,
topcount(
generate([Client Host].[Client Geography].[City]
,{[Client Host].[Client Geography].currentmember}
*[HoursOfDay].[HoursOfDay].[Hour Of Day]
*[Date].[Year Month Day].[Day])
,10,[Measures].[Bytes Total])
on Rows
from EasternMining
The generate statement is breaking the query into a couple of steps, so that the largest set will probably be the Days*Hours, from which it is only keeping the top 10 for each city. The outside set, for every city, will only have 10 rows per city. The query is logically equivalent to the first query, meaning it will return the same results.
We could take this logic further with a second generate statement so the inside query only has 1o rows per city day combination.
select
[Measures].[Bytes Total] on Columns,
topcount(
generate([Client Host].[Client Geography].[City]
,topcount(
generate([HoursOfDay].[HoursOfDay].[Hour Of Day]
,topcount({[HoursOfDay].[HoursOfDay].currentmember}
*{[Client Host].[Client Geography].
currentmember}
*[Date].[Year Month Day].[Day]
,10,[Measures].[Bytes Total]))
,10,[Measures].[Bytes Total]))
,10,[Measures].[Bytes Total])
on Rows
from EasternMining
We can improve this query further by requesting nonempty() sets
select
[Measures].[Bytes Total] on Columns,
topcount(
generate(nonempty([Client Host].[Client Geography].[City],[Measures].[Bytes Total])
,topcount(
generate(nonempty([HoursOfDay].[HoursOfDay].[Hour Of Day],[Measures].[Bytes Total])
,topcount({[HoursOfDay].[HoursOfDay].currentmember}
*{[Client Host].[Client Geography].currentmember}
*nonempty([Date].[Year Month Day].[Day],[Measures].[Bytes Total])
,10,[Measures].[Bytes Total]))
,10,[Measures].[Bytes Total]))
,10,[Measures].[Bytes Total])
on Rows
from EasternMining
The NonEmpty() function is a very simple way to reduce the set size, and of course it can be done without using the generate() function. So going back to the original query, we might have found that the following change was sufficient to avoid resource errors.
select
[Measures].[Bytes Total] on Columns,
topcount(
nonempty(
[Client Host].[Client Geography].[City]
*[HoursOfDay].[HoursOfDay].[Hour Of Day]
*[Date].[Year Month Day].[Day]
,[Measures].[Bytes Total])
,10,[Measures].[Bytes Total])
on Rows
from EasternMining
However, I wanted to show the generate() function first, as it can improve the query in a way that the nonempty() cannot.
I should add that generate() and nonempty() functions are not panaceas for MDX query performance. The more you know MDX and the way SSAS executes the query, the more you will have in your toolkit to improve query performance.
Saturday, July 16, 2011
MDX Root() function doesn't support multiselect
 One of my other favourite MDX functions is Root(). It's a really easy way to get all the filters off a dimension. I often use it in calculations defined in the cube.
However the Root() function does not support multi-select and you might get this error message.
#Error Query (6, 30) The MDX function ROOT failed because the coordinate for the 'Region' attribute contains a set.
Fortunately, there is a workaround. Unfortunately, it means not using the Root() function and going back to the .[All] member of all the attributes (or all the ones being used in the query) of the dimension.
For example, the following query will hit the error.
WITH
MEMBER [Client Host].Region.[AfricaAsia] AS
AGGREGATE({[Client Host].Region.&[Africa]
,[Client Host].Region.&[Asia]})
MEMBER Measures.[HitsPercent] as
[Measures].[Request Count]/(ROOT([Client Host]), [Measures].[Request Count])
SELECT
{Measures.[HitsPercent]}
ON COLUMNS
,[Date].[Month].[Month]
ON ROWS
FROM [EasternMining]
WHERE
([Client Host].Region.[AfricaAsia])
The fix is simply to change Root([Client Host]) to [Client Host].Region.[All]. ie.
WITH
MEMBER [Client Host].Region.[AfricaAsia] AS
AGGREGATE({[Client Host].Region.&[Africa]
,[Client Host].Region.&[Asia]})
MEMBER Measures.[HitsPercent] as
// [Measures].[Request Count]/(ROOT([Client Host]), [Measures].[Request Count])
[Measures].[Request Count]/([Client Host].Region.[All], [Measures].[Request Count])
,format_string="#,#0.00%"
,non_empty_behavior="measures.[Request Count]"
SELECT
{Measures.[HitsPercent]}
ON COLUMNS
,[Date].[Month].[Month]
ON ROWS
FROM [EasternMining]
WHERE
([Client Host].Region.[AfricaAsia])
Note, I have only put the .[All] member in for the Region attribute, whereas you really need to add in a .[All] member for all the dimension attributes to be equivalent to the Root() function.
By the way, I don't know why the Root() function doesn't support multi-select. One would imagine that it should.
Because of this limitation, I might be using the Root() function less liberally in calculations stored in the cube.
Wednesday, May 4, 2011
MDX for Top n by group
 Here is a little MDX that will get the top n list for each of another set of members.
For example, for Each region, I might want to get a list of the top images in that region.
The query is very simple, just a matter of employing the generate function.
select [Measures].[Hits] on 0,
non empty
generate([Client Host].[Client Geography].[Region],
([Client Host].[Client Geography],
topcount(order([Target].[Resource Hierarchy].[Resource Type].&[.jpg].children,[Measures].[Hits],bdesc),10)))
on 1
from EasternMining
You can plug in the grouping, ordering that you want. Even nested top n lists.
Monday, February 14, 2011
Anything is possible with MDX
I was with one of my favourite customers last week and had an impromptu challenge put before me. We had a cube containing the company's sales data and the challenge was to reproduce a report they had created in their legacy system. (I found out later that this report had taken a couple of months to produce.) The requirement was to create a report that would display the last 7 days of a particular outlet and for each day show the sales and transactions for the top hour of that day.
tail(nonempty([Date].[Year Month Day].[Day],[Measures].[Bytes Total]),7)
with
set Last7Days as tail(nonempty([Date].[Year Month Day].[Day],[Measures].[Bytes Total]),7)
member Measures.TopHourName as order([HoursOfDay].[Hour Of Day],[Measures].[Hits],BDESC).item(0).member_caption
member Measures.TopHourSessions as (order([HoursOfDay].[Hour Of Day],[Measures].[Hits],BDESC).item(0),[Measures].[Sessions])
member Measures.TopHourHits as (order([HoursOfDay].[Hour Of Day],[Measures].[Hits],BDESC).item(0),[Measures].[Hits])
select
{Measures.TopHourName,Measures.TopHourSessions,Measures.TopHourHits} on columns,
[Date].[Month].[Month]*Last7Days on rows
from EasternMining
where ([Client Host].[Client Geography].[Region].&[Americas].[UNITED STATES])
I have often been quoted as saying that if the data is in the cube, one MDX query can answer any question that you might have. So the pressure was on to create the report. Fortunately, they were using ReportPortal software, which is a highly functional thin client tool, and it has good charting capability. The web browser tool allows you to create your own sets and calculated members. So all I really needed to do was create a set for the last 7 days. I will reproduce a similar query using my weblog database, which has comparable dimensions.
Here is a set declaration for the last 7 business days.
tail(nonempty([Date].[Year Month Day].[Day],[Measures].[Bytes Total]),7)
The calculated members for the top hour etc are simply a matter of taking the top hour and getting the attribute/tuple require. Here is the full query on my weblog database. Note, the good thing about a tool like ReportPortal is that you can declare sets and calculated members and it will still honour filters and hierarchies that you have dragged and dropped on rows/columns. So the only MDX you need to write is for the set and calculated member, the rest of the report is created by dragging and dropping from the palette.
with
set Last7Days as tail(nonempty([Date].[Year Month Day].[Day],[Measures].[Bytes Total]),7)
member Measures.TopHourName as order([HoursOfDay].[Hour Of Day],[Measures].[Hits],BDESC).item(0).member_caption
member Measures.TopHourSessions as (order([HoursOfDay].[Hour Of Day],[Measures].[Hits],BDESC).item(0),[Measures].[Sessions])
member Measures.TopHourHits as (order([HoursOfDay].[Hour Of Day],[Measures].[Hits],BDESC).item(0),[Measures].[Hits])
select
{Measures.TopHourName,Measures.TopHourSessions,Measures.TopHourHits} on columns,
[Date].[Month].[Month]*Last7Days on rows
from EasternMining
where ([Client Host].[Client Geography].[Region].&[Americas].[UNITED STATES])
Like all good cube browers, ReportPortal will graph your res ults. In this case, the most appropriate chart was a hybrid column/line chart, with sales as columns on the left hand y axis and transactions as a line on the right hand y axis.
 ults. In this case, the most appropriate chart was a hybrid column/line chart, with sales as columns on the left hand y axis and transactions as a line on the right hand y axis.
The takeaway from this is that, so long as the cube has the necessary data, a single MDX query can get the answer to any question.
Sunday, December 12, 2010
Warming the OLAP cache
Analysis Services has a data (and aggregation cache) not dissimilar to a relational database cache. For really good cube performance it is desirable to have most of your cube resident in the cache. Querying the cube will help bring data into the cache, while cube processing will tend to clear the cache. More accurately, partition processing (incremental or full) will clear that entire partition from the cache.
 You can help warm the cache by executing MDX queries, or you can execute the CREATE CACHE statement. The CREATE CACHE statement looks similar to a regular MDX query, the main difference being a resultset is not returned. For example
CREATE CACHE FOR [EasternMining] AS
[Port].[Ports].&[80]
*{[Measures].Members}
*{[Date].[Year Month Day].[Year].&[2010].[January].[1]
:[Date].[Year Month Day].[Year].&[2010].[December].[3]}
go
CREATE CACHE FOR [EasternMining] AS
[Port].[Ports].&[80]
*{[Measures].Members }
*[HoursOfDay].[Hour Of Day]
*{[Date].[Year Month Day].[Year].&[2010].[November].[1]
:[Date].[Year Month Day].[Year].&[2010].[December].[3]}go
 Notice now, all the Query subcubes have an EventClass of "Cache data". This means that AS has found the data for this query in the cache. Also note, the duration for the first subcube is 0ms. This is a great improvement over the original cold cache subcube of 47ms.
Analysis Services, by default, will freely use 65% of a computer's memory, so data should not be pushed out of the cache unless AS is using 65% of memory. With commodity 64 bit servers, the memory available to Analysis Services should be, at least, in the tens of GBytes.
Here is an example of a query that has been run on a cold cache. Notice how the first Query Subcube has an EventClass of "non-cache data". This means that the storage engine is going to disk since the data/aggregations are not in cache.
You can help warm the cache by executing MDX queries, or you can execute the CREATE CACHE statement. The CREATE CACHE statement looks similar to a regular MDX query, the main difference being a resultset is not returned. For exampleCREATE CACHE FOR [EasternMining] AS
[Port].[Ports].&[80]
*{[Measures].Members}
*{[Date].[Year Month Day].[Year].&[2010].[January].[1]
:[Date].[Year Month Day].[Year].&[2010].[December].[3]}
go
CREATE CACHE FOR [EasternMining] AS
[Port].[Ports].&[80]
*{[Measures].Members }
*[HoursOfDay].[Hour Of Day]
*{[Date].[Year Month Day].[Year].&[2010].[November].[1]
:[Date].[Year Month Day].[Year].&[2010].[December].[3]}go
Now let's run the query again and check the Profiler trace. Here is the output
Notice now, all the Query subcubes have an EventClass of "Cache data". This means that AS has found the data for this query in the cache. Also note, the duration for the first subcube is 0ms. This is a great improvement over the original cold cache subcube of 47ms.
Generally, it is a good practice to warm the cache after cube processing. This will help the performance of the first few queries that hit the cube after processing.
By the way, when warming the cache you should be aware of SSAS' limitation in keeping data in the cache see http://richardlees.blogspot.com.au/2011/12/why-doesnt-ssas-cache-entire-cube.html
By the way, when warming the cache you should be aware of SSAS' limitation in keeping data in the cache see http://richardlees.blogspot.com.au/2011/12/why-doesnt-ssas-cache-entire-cube.html
Also, as a cube designer, you should be aware of the cache warming effect and design partitions so that you isolate the volatile data as much as possible, so that you minimise cache clearing when processing.
If you want to experiment with cache warming, you will probably want the ability to clear the cache quickly. Here is an example of a cache clearing statement for a cube
Here is the MDX query I used in the demonstration above
WITH
member measures.MyCalc as
avg(tail(nonempty([Date].[Year Month Day].[Year].&[2010].[November].[1]
:[Date].[Year Month Day].[Year].&[2010].[December].[3].lag(1)
,[Measures].[Bytes Total]),6)
,[Measures].[Bytes Total])
SELECT {measures.MyCalc} ON COLUMNS ,
{[HoursOfDay].[All HoursOfDay].[00:00-01:59].[00:00-00:59],[HoursOfDay].[All HoursOfDay].[00:00-01:59].[01:00-01:59],
[HoursOfDay].[All HoursOfDay].[02:00-03:59].[02:00-02:59],[HoursOfDay].[All HoursOfDay].[02:00-03:59].[03:00-03:59],
[HoursOfDay].[All HoursOfDay].[04:00-05:59].[04:00-04:59],[HoursOfDay].[All HoursOfDay].[04:00-05:59].[05:00-05:59],
[HoursOfDay].[All HoursOfDay].[06:00-07:59].[06:00-06:59] ,[HoursOfDay].[All HoursOfDay].[06:00-07:59].[07:00-07:59],
[HoursOfDay].[All HoursOfDay].[08:00-09:59].[08:00-08:59],[HoursOfDay].[All HoursOfDay].[08:00-09:59].[09:00-09:59] }
ON ROWS
FROM EasternMining
WHERE ([Port].[Ports].&[80] )
member measures.MyCalc as
avg(tail(nonempty([Date].[Year Month Day].[Year].&[2010].[November].[1]
:[Date].[Year Month Day].[Year].&[2010].[December].[3].lag(1)
,[Measures].[Bytes Total]),6)
,[Measures].[Bytes Total])
SELECT {measures.MyCalc} ON COLUMNS ,
{[HoursOfDay].[All HoursOfDay].[00:00-01:59].[00:00-00:59],[HoursOfDay].[All HoursOfDay].[00:00-01:59].[01:00-01:59],
[HoursOfDay].[All HoursOfDay].[02:00-03:59].[02:00-02:59],[HoursOfDay].[All HoursOfDay].[02:00-03:59].[03:00-03:59],
[HoursOfDay].[All HoursOfDay].[04:00-05:59].[04:00-04:59],[HoursOfDay].[All HoursOfDay].[04:00-05:59].[05:00-05:59],
[HoursOfDay].[All HoursOfDay].[06:00-07:59].[06:00-06:59] ,[HoursOfDay].[All HoursOfDay].[06:00-07:59].[07:00-07:59],
[HoursOfDay].[All HoursOfDay].[08:00-09:59].[08:00-08:59],[HoursOfDay].[All HoursOfDay].[08:00-09:59].[09:00-09:59] }
ON ROWS
FROM EasternMining
WHERE ([Port].[Ports].&[80] )
Sunday, October 10, 2010
SSAS Dynamic Security
Imagine the scenario where there are hundreds or thousands of cube use rs, most of which are only permitted to see "their" data. And there is a dimension with an attribute containing their Windows userid. It would be very tedious to set up a security role for every individual. Not to mention the maintenance in adding and deleting roles. Although this could be somewhat automated with AMO scripting.
 rs, most of which are only permitted to see "their" data. And there is a dimension with an attribute containing their Windows userid. It would be very tedious to set up a security role for every individual. Not to mention the maintenance in adding and deleting roles. Although this could be somewhat automated with AMO scripting.
A technique I like to employ is to set up just one SSAS role, which essentially contains everyone that might have some access to the cube (integrated security only). So, in the Dimension Data security tab, I restrict the "Allowed member set" to just those members where the member name is equal to the username(). Username() is an mdx function that returns the Windows userid.
The Allowed member set might look something like
{StrToMember("Branch.BranchManager.&[" + UserName() + "]")}
The default member could be
StrToMember("Branch.BranchManager.&[" + UserName() + "]")
You can add other roles, for example, one with read access to the entire cube. So the users that can only see their Branch, would be in the first role (they would only be able to see their own branch) and head office users in the second role would be able to see the entire cube.
This is a very elegant solution. As you can see, it requires no maintenance, as new/old users will automatically be able to see their own data. If the branch manager changes, the old user will have no read access and the new user will have read access to that branch.
There are many ways to extend this security. I have combined it with application tables that list users' access. This can be a many-to-one or many-to many relationship. No problem, just create a dimension (possibly many-to-many) , and grant read access to the dimension in the same way. Also, it might be that you only want part of the username, or that you want/don't want the domain. Again, that is no problem, you can use VBA functions in the MDX expression to get the substring that you want. You could also use this technique to manage a black list (Denied member set) instead of a white list (Allowed member set).
A classic use of this technique would be to support sales persons to see information relating to their customers. This technique might be combined with other restrictions. For example the dynamic security role might let browsers see a subset of their data, such as quantities, but not dollar values. And only for their customers.
Note, there is an overhead in Dimension Data security, but in my experience it is almost undetectable. Of more concern, if you needed to use it, would be the many-to-many dimension. Be wary of performance if your m2m dimension and/or m2m fact table is large.
Also note, you probably want to check the "Enable Visual Totals" check box, so that users can only see the total for members they are allowed to see.
The use of this dynamic security technique can be used in conjunction with conventional roles in the same cube.
Monday, July 26, 2010
Getting the last non empty value
LastNonEmpty is an aggregation function available in the Enterprise version of SQL Server. However, you can create your own with a little bit of recursive MDX. Essentially, you simply create a calculated member that returns the non empty value, or if empty, it looks in the previous member. It really is very simple, and is an elegant way of writing a last non empty query. To create a LastNonEmpty calculate measure, simple use MDX such as the following

With Member Measures.LastHits as
iif(isempty(Measures.Hits),
([Date].[Year Month Day].prevmember,
Measures.LastHits
),Measures.Hits)
Member Measures.LastHitsMTD as
sum(PeriodsToDate([Date].[Year Month Day].[Month],[Date].[Year Month Day]),Measures.LastHits)
select
{Measures.Hits,Measures.LastHits,Measures.LastHitsMTD}
on Columns,
tail([Date].[Year Month Day].[Day],31)
on rows
from
EasternMining

With Member Measures.LastHits as
iif(isempty(Measures.Hits),
([Date].[Year Month Day].prevmember,
Measures.LastHits
),Measures.Hits)
iif(isempty(Measures.Hits),
([Date].[Year Month Day].prevmember,
Measures.LastHits
),Measures.Hits)
Notice how the calculated member is called LastHits, and the calculation actually refers to LastHits. This is the recursion. It keeps referring back to itself until it gets a day with a non empty value. If there are no non empty values, the recursion will automatically stop at the first day in your dimension and return null.
Naturally, you can add other calculations on top of this recursive calculation. For example, you might want to sum up the month to date figures using this non empty calculation. No problem, here is a MTD calculation using the last non empty calculation above.

With Member Measures.LastHits as
iif(isempty(Measures.Hits),
([Date].[Year Month Day].prevmember,
Measures.LastHits
),Measures.Hits)
Member Measures.LastHitsMTD as
sum(PeriodsToDate([Date].[Year Month Day].[Month],[Date].[Year Month Day]),Measures.LastHits)
select
{Measures.Hits,Measures.LastHits,Measures.LastHitsMTD}
on Columns,
tail([Date].[Year Month Day].[Day],31)
on rows
from
EasternMining
For examples of real-time OLAP queries on continually updating databases see http://RichardLees.com.au/Sites/Demonstrations
Thursday, July 15, 2010
Querying Analysis Services For Cube Metadata
SSAS DMVs can be very useful in providing metadata information. Ie.
WITH
member measures.HierarchyCount as dimensions.count
set HierarchySet as tail([Date].[Year Month Day].[Day],measures.HierarchyCount)
member measures.MyHierarchyNo as rank([Date].[Year Month Day],HierarchySet)-1
member measures.DimensionName as
left(dimensions(measures.MyHierarchyNo).dimension.unique_name,
instr(dimensions(measures.MyHierarchyNo).dimension.unique_name,".")-1)
member measures.MyHierarchy as dimensions(measures.MyHierarchyNo).name
member measures.HierarchyLevels as dimensions(measures.MyHierarchyNo).levels.count
member Measures.Level1Name as
case when Measures.HierarchyLevels>1 then dimensions(measures.MyHierarchyNo).levels(1).name else null end
member Measures.Level2Name as
case when Measures.HierarchyLevels>2 then dimensions(measures.MyHierarchyNo).levels(2).name else null end
member Measures.Level3Name as
case when Measures.HierarchyLevels>3 then dimensions(measures.MyHierarchyNo).levels(3).name else null end
member Measures.Level4Name as
case when Measures.HierarchyLevels>4 then dimensions(measures.MyHierarchyNo).levels(4).name else null end
member Measures.Level5Name as
case when Measures.HierarchyLevels>5 then dimensions(measures.MyHierarchyNo).levels(5).name else null end
member Measures.Level6Name as
case when Measures.HierarchyLevels>6 then dimensions(measures.MyHierarchyNo).levels(6).name else null end
member Measures.Level7Name as
case when Measures.HierarchyLevels>7 then dimensions(measures.MyHierarchyNo).levels(7).name else null end
member Measures.Level8Name as
case when Measures.HierarchyLevels>8 then dimensions(measures.MyHierarchyNo).levels(8).name else null end
SELECT NON EMPTY
{measures.DimensionName
,Measures.MyHierarchy
,Measures.HierarchyLevels
,Measures.Level1Name
,Measures.Level2Name
,Measures.Level3Name
,Measures.Level4Name
,Measures.Level5Name
,Measures.Level6Name
,Measures.Level7Name
,Measures.Level8Name
} ON Columns,
HierarchySet on Rows
FROM EasternMining
 Just replace the Date hierarchy name with a hierarchy from your own cube. This hierarchy is used to list out the attributes, so just ensure there are at least a few hundred members. These members are used to drive the query.
Not sure when this would be useful. Perhaps if you only had browser access to a cube, it did not support DMVs, and you needed to see hidden attributes.
$SYSTEM.MDSCHEMA_CUBES
$SYSTEM.MDSCHEMA_DIMENSIONS
$SYSTEM.MDSCHEMA_FUNCTIONS
$SYSTEM.MDSCHEMA_HIERARCHIES
$SYSTEM.MDSCHEMA_INPUT_DATASOURCES
$SYSTEM.MDSCHEMA_KPIS
$SYSTEM.MDSCHEMA_LEVELS
$SYSTEM.MDSCHEMA_MEASUREGROUP_DIMENSIONS
$SYSTEM.MDSCHEMA_MEASUREGROUPS
$SYSTEM.MDSCHEMA_MEASURES
$SYSTEM.MDSCHEMA_MEMBERS
$SYSTEM.MDSCHEMA_PROPERTIES
$SYSTEM.MDSCHEMA_SETS
WITH
member measures.HierarchyCount as dimensions.count
set HierarchySet as tail([Date].[Year Month Day].[Day],measures.HierarchyCount)
member measures.MyHierarchyNo as rank([Date].[Year Month Day],HierarchySet)-1
member measures.DimensionName as
left(dimensions(measures.MyHierarchyNo).dimension.unique_name,
instr(dimensions(measures.MyHierarchyNo).dimension.unique_name,".")-1)
member measures.MyHierarchy as dimensions(measures.MyHierarchyNo).name
member measures.HierarchyLevels as dimensions(measures.MyHierarchyNo).levels.count
member Measures.Level1Name as
case when Measures.HierarchyLevels>1 then dimensions(measures.MyHierarchyNo).levels(1).name else null end
member Measures.Level2Name as
case when Measures.HierarchyLevels>2 then dimensions(measures.MyHierarchyNo).levels(2).name else null end
member Measures.Level3Name as
case when Measures.HierarchyLevels>3 then dimensions(measures.MyHierarchyNo).levels(3).name else null end
member Measures.Level4Name as
case when Measures.HierarchyLevels>4 then dimensions(measures.MyHierarchyNo).levels(4).name else null end
member Measures.Level5Name as
case when Measures.HierarchyLevels>5 then dimensions(measures.MyHierarchyNo).levels(5).name else null end
member Measures.Level6Name as
case when Measures.HierarchyLevels>6 then dimensions(measures.MyHierarchyNo).levels(6).name else null end
member Measures.Level7Name as
case when Measures.HierarchyLevels>7 then dimensions(measures.MyHierarchyNo).levels(7).name else null end
member Measures.Level8Name as
case when Measures.HierarchyLevels>8 then dimensions(measures.MyHierarchyNo).levels(8).name else null end
SELECT NON EMPTY
{measures.DimensionName
,Measures.MyHierarchy
,Measures.HierarchyLevels
,Measures.Level1Name
,Measures.Level2Name
,Measures.Level3Name
,Measures.Level4Name
,Measures.Level5Name
,Measures.Level6Name
,Measures.Level7Name
,Measures.Level8Name
} ON Columns,
HierarchySet on Rows
FROM EasternMining
 Just replace the Date hierarchy name with a hierarchy from your own cube. This hierarchy is used to list out the attributes, so just ensure there are at least a few hundred members. These members are used to drive the query.
Not sure when this would be useful. Perhaps if you only had browser access to a cube, it did not support DMVs, and you needed to see hidden attributes.
Friday, April 16, 2010
Improving Excel's Cube Performance
I am often asked to help with Excel's query performance. The cube is fast and efficient, but some Excel queries are slow due to the MDX that Excel is generating.
 I have traced the MDX using SQL Profiler. See the MDX in the picture to the
 right. (I have formatted the MDX. Wouldn't it be a nice thing if SQL EM would format SQL/MDX for us? That's a topic for another blog.) If you execute this MDX, you will receive 3840 rows! That is a huge number, when you consider there is only one customer and Excel is only displaying 1 row. (I asked for a tabular format. But even if I ask for a compact format, I only get 14 rows.) Understandably, this MDX takes 14 seconds to execute.
 Another, much cleaner, option, if possible, is to simply show properties of existing members, rather than ask for a crossjoin. I say, if possible, as this is only possible if the parent attribute is in the report. Naturally, this is much more efficient, as the generated MDX is simply asking for the member properties of existing members (crossjoin not required).
This is unfortunate, but there a couple of things you can do about it. Let me describe this particular issue. Essentially, you have a dimension with a large number of attributes. In Excel, you have crossjoined many of these attributes on rows, which you feel is reasonable since you have also added a filter so that the query will only return a small number of rows. For example, here is a query of the FoodmartFull database, where I have filtered on just one customer surname (Peacock) and asked for many customer attributes on rows. This query takes 9 seconds for SQL Server 2008 to execute. The reason it takes so long is that the MDX is asking for a crossjoin of all the attributes, at all levels. Note, this issue can be so bad that the results are not returned before timeout.
I have traced the MDX using SQL Profiler. See the MDX in the picture to the right. (I have formatted the MDX. Wouldn't it be a nice thing if SQL EM would format SQL/MDX for us? That's a topic for another blog.) If you execute this MDX, you will receive 3840 rows! That is a huge number, when you consider there is only one customer and Excel is only displaying 1 row. (I asked for a tabular format. But even if I ask for a compact format, I only get 14 rows.) Understandably, this MDX takes 14 seconds to execute.
The reason I chose this particular query is that all of the attributes you see in the Excel report are from the same dimension. Having all these attributes from the same dimension should be very easy for Analysis Services to return quickly, since it can determine, from the dimension, exactly which Customer cells/aggregations it needs.
I can edit the MDX to simply ask for the crossjoin of the leaf members, which will execute in just 1 second. This is much easier for Analysis Services since we are only asking for asingle row rather than 3840. See the second query. 

Of course it is not possible to edit Excel's MDX to make the query faster, but we do have other tricks we can employ. Since the problem is that Excel is inefficiently crossjoin-ing all of the attribute hierarchy sets, we can help Excel by creating a "whopper" user hierarchy that includes all (or many) the attributes we want in our report. If we had a Customer hierarchy with these attributes, Excel wouldn't need to ask for any (or so many) crossjoins and the query will be sub second. Of course, I am not suggesting that you create "whopper" hierarchies all over the place, but it is a consideration. Also note, you do not need to create one "whopper" hierarchy, just a couple of multi-attribute hierarchies might do the trick. This is because the cost of adding (or reducing) the number of hierarchies has an exponential effect on query performance. Each attribute you add will crossjoin the new set (it is not a single member set) with all other rows.
 Another, much cleaner, option, if possible, is to simply show properties of existing members, rather than ask for a crossjoin. I say, if possible, as this is only possible if the parent attribute is in the report. Naturally, this is much more efficient, as the generated MDX is simply asking for the member properties of existing members (crossjoin not required).
Whenever there is an Excel performance issue, I would encourage you to trace the MDX using Profiler. Even though you can't directly change Excel's MDX, it will help you understand the problem and give you some ideas to work around it.
For a list of Excel PivotTable tips see http://richardlees.blogspot.com/2009/10/excel-2007-olap-pivottable-tips.html
Monday, March 29, 2010
MDX - Group by measure range dynamically
 Here is a similar MDX puzzle. The aim is to aggregate members by the range their measure falls into. For example, aggregate cities into ranges (multiples of 1000) of the number of hits.
Of course, you can hand craft the MDX to define each range, but that's not elegant, scalable or flexible. How about some MDX that dynamically creates the ranges?
 Here is a solution from my Weblogs database. The query is aggregating the number of hits for all cities with hits in the 0 - 999 range, 1000 - 1999 range etc. See how it uses recursive MDX, very similar to the preceding blog, which aggregates by distinct member_caption. Recursive MDX really is very useful.
Here is what the output looks like. Note; ignore the city name, that is just the last city in the range. The first measure column has the range limit, the second column has the number of cities and the third measure has the total hits for that range.
To view the cube I used, see http://RichardLees.com.au/Sites/Demonstrations
Saturday, November 21, 2009
MDX is a redundant language
It is often said that SQL is a redundant language, since all but the most simple queries can be written many different ways. Well, I find MDX much more redundant than SQL. There really are thousands of ways to express the same logical query. I like this, since it means that there are lots of opportunities to tune the query by writing it in a different way. Just like SQL. As an MDX writer, I encourage you to strengthen your ability to write queries in different (redundant) ways. This will make you more powerful in query writing and give you more performance opportunities.
select
{measures.hits,measures.sessions,Measures.[bytes total]} on 0,
tail([Date].[Year Month Day].[Month],12) on 1
from
(select {[Client Host].[Client Geography].[Region].&[Asia].[AUSTRALIA],
[Client Host].[Client Geography].[Region].&[Asia].[NEW ZEALAND]} on 0
from [EasternMining])
Here is a simple example, which involves one of the most common "brick walls" hit by new MDX writers. You want to write a query that would be the logical equivalent of
with member [Client Host].[Client Geography].ANZ as
sum({[Client Host].[Client Geography].[Region].&[Asia].[AUSTRALIA],
[Client Host].[Client Geography].[Region].&[Asia].[NEW ZEALAND]})
select
{measures.hits,measures.sessions,Measures.[bytes total]} on 0,
tail([Date].[Year Month Day].[Month],12) on 1
from [EasternMining]
where [Client Host].[Client Geography].ANZ
sum({[Client Host].[Client Geography].[Region].&[Asia].[AUSTRALIA],
[Client Host].[Client Geography].[Region].&[Asia].[NEW ZEALAND]})
select
{measures.hits,measures.sessions,Measures.[bytes total]} on 0,
tail([Date].[Year Month Day].[Month],12) on 1
from [EasternMining]
where [Client Host].[Client Geography].ANZ

Here is another way to write exactly the same query
select
{measures.hits,measures.sessions,Measures.[bytes total]} on 0,
tail([Date].[Year Month Day].[Month],12) on 1
from
(select {[Client Host].[Client Geography].[Region].&[Asia].[AUSTRALIA],
[Client Host].[Client Geography].[Region].&[Asia].[NEW ZEALAND]} on 0
from [EasternMining])
Of course there are many other ways of expressing this same query. I would not suggest that you should use one technique over the other. It really depends on which one is easier to read, easier to maintain, and runs faster.

For online real-time OLAP and data mining demonstrations goto http://RichardLees.com.au/Sites/Demonstrations
Tuesday, September 29, 2009
My Calculated Member is slow

Have you written a calculated member that is performing very slowly, while the underlying physical measures are fast? This could be a common cube query performance issue that has a very quick remedy.
Essentially, AS want to know when to treat this as an empty cell. If you don't specify the non_empty_behaviour, AS will need to physically calculate all potential cells to determine which ones are actually emtpy. With non_empty_behaviour specified, AS can avoid many calculations, since many blocks of cells are known to be empty. The non_empty_behaviour attribute is appropriate for both SQL Server 2005 and SQL Server 2008.
To remedy, all you need to do is specify the non_emtpy_behaviour for the calculated member.
Note, there are logic implications with non_empty_behaviour. With the example in the picture (hits per web session) it is logical that I would want to return null when the sessions measure is null. This would not be the case if I were calculating a YTD measure, since the measure might be null on the current day, but the calculation needs to add many other days that might not be null.
For live OLAP and data mining demonstrations with real data see http://RichardLees.com.au/Sites/Demonstrations
Monday, August 24, 2009
Dynamic OLAP Reports
The specification from a customer's BI solution, that I just completed, included 3 reports. (The project was really about designing a high performing cube with a hundreds of millions of facts, over 20 real dimensions and updates every 10 minutes.) I love those sort of challenges. Anyway, the 3 reports were essentially the same Profit and Loss Statement at different levels of the business hierarchy. The customer expected 3 reports, and the early BI developer created 3 reports in the PoC, however I created one report that could navigate up and down the business hierarchy with hyperlinks. Needless to say, the customer was delighted to have one report and the flexibility to click up and down the business. This is similar to a blog I made some time ago. I encourage BI developers to use SQL Server Reporting Services Reports (SSRS) on OLAP cubes to create fast and linked reports so that the reports appear like an application to the end user.
Adding hyperlinks to another report in SSRS is really simple, you just right click on the text box, asking for text box properties and clicking on Action Go to Report. The parameters need to be configured. In my case, the parameter for the business unit is created using the current member's unique name and its parent's unique name. So a tiny bit of MDX is required. That brings me onto another of my soapbox themes. BI developers should know MDX. If your BI developer doesn't know MDX, he/she is unlikely to be able to design high performing cubes and will not know how to exploit all the available functionality. it's a bit like asking someone to design a relational data warehouse for you, who doesn't know SQL very well. Good MDX skills are a predicate for good cube designs.
I can't provide the example of my customer's report, but you can see examples of dynamic and linked reports on http://RichardLees.com.au/Sites/Demonstrations
Adding hyperlinks to another report in SSRS is really simple, you just right click on the text box, asking for text box properties and clicking on Action Go to Report. The parameters need to be configured. In my case, the parameter for the business unit is created using the current member's unique name and its parent's unique name. So a tiny bit of MDX is required. That brings me onto another of my soapbox themes. BI developers should know MDX. If your BI developer doesn't know MDX, he/she is unlikely to be able to design high performing cubes and will not know how to exploit all the available functionality. it's a bit like asking someone to design a relational data warehouse for you, who doesn't know SQL very well. Good MDX skills are a predicate for good cube designs.
I can't provide the example of my customer's report, but you can see examples of dynamic and linked reports on http://RichardLees.com.au/Sites/Demonstrations
Friday, June 26, 2009
Reporting Services Tips for OLAP Cubes
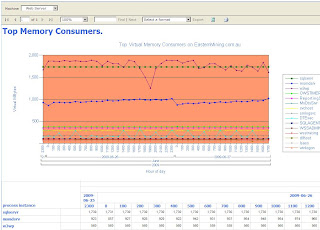 Naturally I have an inclination to use Reporting Services on OLAP cubes. My feeling is that reports should by and large be run from OLAP cube where they can be dynamic and fast. SQL based reports are more ideally suited for "atomic data" reports (eg transaction lists) and some special reports requiring real time data.
There are a few funnies when you get into OLAP reports with SSRS. The SSRS wizard does a great job of starting the report and building the parameters you need. However, before long you will need to edit the MDX that the wizard creates, to do things like taylor the parameter queries for cascading filters. Here are a couple of tricks that I commonly use.
In SSRS 2008, when you edit any MDX query, the designer will automatically rebuild (in other words wash out any MDX changes you have made) input parameter queries. The simple work around for this frustrating behaviour is to remove the Dimension and Hierarchy values from the query's parameter list.

You might want to use the SSRS calendar control for easy date picking, which is used to filter an OLAP date dimension. This isn't handled automatically, but can be achieved with the following. Change the parameter property to be Date/Time datatype. That will ensure that SSRS uses the date picker. For most reports you will want to dynamically specify the default. This can be simply achieved by a single row OLAP query (for example the last day with data) or from today's date using the now() function. If you use the now() function you can strip off the time with =cdate(format(now(),"yyyy-MM-dd")). The trick now is to use the datetime parameter in your MDX query. What you need to do is construct a full member name using the known dimension-hierarchy names and contruct the member key using the date. The construction of the key will depend on what you have defined as the key of the date hierarchy. If the key is a date, then the fully qualified member name will look something like this. [Date].[Calendar].[TheDate].&[2009-06-26T00:00:00]. So to include the date parameter in your query you can include something like the following in your query strtomember("[Date].[Calendar].[TheDate].&["+format(now(),"yyyy-MM-dd")+"T00:00:00]") Just replace [Date] [Calendar] and [TheDate] with the dimension, hierarchy and level name from your dimension. The MDX query tool in SQL Enterprise Manager will help by providing a sample member. The date parameter might simply be used in the WHERE clause to filter the query or it might be part of a range specification etc. It's a member specification and as such could be used anywhere in your query.
Not so much of a tip, but more of an apology. The MDX query editor in SSRS is a very poor text editor. When I am editing an MDX query, I invariably cut and paste the query into and out of SQL Enterprise Manager Query tool.
Here is an easy way to get a report line number. =RunningValue(1, SUM, "Invoice_Data") The line number can also be used for alternate line shading.
Check the performance of all the MDX queries. If any of them are not running fast enough, see if there is anything you can do to speed them up. One classic way to improve performance and improve report usability is to filter out empty members.
Another classic way to improve performance is to change the use of any single select parameters from StrToSet() to StrToMember() and placed on the WHERE clause.
Just like SQL reports. Or perhaps more so, since OLAP reports are more likely to be run dynamically, link your reports together so that users can easily navigate down and across reports. Essentially, making it easier for users to drill through to focus the salient data. With SSRS reports on OLAP this can be achieved in such a way that users do not need to know anything about databases or even that a cube is behind the report. They simply click on headings or numbers to drill into and across the data that interests them. For example, click on the "Top Memory Consumers" picture above for an OLAP report. The report is dynamic and close to real time. Notice how you can click on any of the processes and get an analysis of that process. Likewise, you can click on any of the counters in that report for a breakdown of the processes using that resource. A good set of dynamic SSRS reports will appear more like an application to end users than a traditional list of static reports.
One last tip is to verify that all the queries in your report definition are actually used. Sometimes SSRS will create new queries for you when you edit parameters. Or you might modify a report and remove a parameter. Do remember to take out the unused queries. All queries appear to fire even if they aren't used.
For examples of real time OLAP reports see http://RichardLees.com.au/Sites/Demonstrations
Subscribe to:
Posts (Atom)

