Showing posts with label olap cubes. Show all posts

Monday, August 19, 2019

AWS Redshift Performance versus SQL Multidimensional and Tabular cubes

This is an update to my recent blog AWS Redshift versus SQL Server cube. This performance benchmark includes SQL Server's Tabular cube technology, which wasn't possible as the in-memory database required more memory than available in the test server.
This updated benchmark includes
  • AWS Redshift
  • SQL Columnstore
  • SQL Multidimensional Cube
  • SQL Tabular Cube

The cubes were the slam dunk winners, which shouldn't surprise any Data Platform Architects. For many Data Platform Architects, this will validate their use of columnar databases for atomic data combined with an OLAP cube for fast and scalable BI queries.

The races within the race were interesting. With Multidmensional beating Tabular by a factor of two, and SQL Columnstore beating AWS Redshift by a factor of two also.

For the full report goto AWS Redshift versus OLAP Cubes Performance Benchmark AWS Redshift versus OLAP cubes: Performance Benchmark.

Saturday, August 10, 2019

AWS Redshift versus SQL Server cube

Here is a straight out performance benchmark between AWS' Redshift, SQL Server cube, and SQL Server columnstore indexing. If you are choosing between these (and potentially other) platforms, this will provide some interesting reading. 
Essentially, the Microsoft cube was 97% faster than Redshift.

Note, I tried to make the test as independent and representative of a retail enterprise's query load as possible. The underlying fact tables contained 100 million, 430 million and 600 million rows. The queries ranged from the banal to common calcs such as "year to date" and "stock days on hand".

If you are serious about making the right decision for your organisation, you might set up a similar test with your own data and popular queries. 

Here is the full report:
Data Platform Performance Paper

This benchmark has been updated to include SQL Tabular cube performance. Here is the updated paper.

Wednesday, November 19, 2014

Relative Dates - Today, Yesterday, LastWeek etc.

A useful little piece of functionality I often add to OLAP cubes is what I call Relative Dates.  In the Date dimension I add attributes CurrentDay, CurrentWeek, CurrentPeriod, CurrentYear etc.  These attributes are simply functions within the Dates dimension view, which gets processed early every morning. For example CurrentDay could be something like
Case
when d.MyDate=convert(date,getdate()) then 'Current Day'
when d.MyDate=convert(date,dateadd(dd,-364,getdate())) then 'Current Day LY'
when d.MyDate=convert(date,dateadd(dd,-1,getdate())) then 'Yesterday'
when d.MyDate=convert(date,dateadd(dd,-365,getdate())) then 'Yesterday LY'
else 'Other days'
end CurrentDay,

Note, Current Day Last Year is -364 days, which will ensure that it will be the same day of week. It's the same as saying -52 weeks.

Note, you only need to process the Date dimension, the large fact tables do not need to be reprocessed, as their Date dimension keys are not changing. It's just the, flexible, attributes of the Date dimension that are changing daily.

Note, it is not practical to create a hierarchy of these attributes as they don't fall within oneanother. For example, Today and Yesterday might be in the same fiscal week, or they might fall in consecutive weeks.

The logic for CurrentWeek etc is a bit more complicated as your case statement will be checking if the FiscalWeek of getdate() is the same as the FiscalWeek of MyDate. Eg.
case
when d.MyWeek=(select dd.MyWeek from tbDates dd where dd.MyDate=convert(date,getdate())) then 'Current Week'
when d.MyWeek=(select dd.MyWeek from tbDates dd where dd.MyDate=convert(date,dateadd(WW,-52,getdate()))) then 'Current Week LY'
when d.MyWeek=(select dd.MyWeek from tbDates dd where dd.MyDate=convert(date,dateadd(WW,-1,getdate()))) then 'Last Week'
when d.MyWeek=(select dd.MyWeek from tbDates dd where dd.MyDate=convert(date,dateadd(WW,-53,getdate()))) then 'Last Week LY'
else 'Other weeks'
end CurrentWeek,

You can do the same sort of logic for Periods, Quarters, and Years. Note, this functionality does not replace Time Intelligence. If anything it adds to it as Time Intelligence will go across the Relative Dates attributes, or, more likely, you can use the Relative Dates attributes to filter dates and use a regular date hierarchy on rows/columns with Time Intelligence. The advantage of the CurrentDay, CurrentWeek, CurrentPeriod, and CurrentYear attributes is that reports can be relative in time. Ie, the filter can be a multi-select of this period and last period, showing weeks on columns, which will have 5-9 weeks.  So the report will always display the last 5-9 weeks, without the user having to select the current period etc. These filters will work in Reporting Services, Excel, PerformancePoint, or any other cube browser/reporting tool.

Sunday, December 11, 2011

My SSAS databases are corrupted

Did you happen to have a unplanned shutdown?  This is quite likely to be the cause of the failure.  This is unlike SQL Server, which has a transaction log and will always recover databases on restart.
As I have mentioned earlier, SQL Server Analysis Services exploits the Windows File Cache to help minimise IO, which might lead you to suspect the Windows cache.  However SSAS uses the FlushFileBuffers API to minimise the possibility of having dirty pages in the Windows File Cache.  However, this does not protect SSAS from corruption on an unplanned shutdown.
So, if you really want to avoid corrupted SSAS databases on power failure, you should ensure your SSAS servers are supported by UPS.
Most production SSAS servers have UPS.  But, if you don't have UPS, like my demonstration site (http://RichardLees.com.au/Sites/Demonstrations) and, like my site, the cubes are continually updating, when the power fails, SSAS databases have a good chance of being corrupted.  The only solution to this, that I know of, is to restore the affected (typically all) SSAS databases.  I find the quickest way to do this is to stop SSAS, empty the SSAS data directory, start SSAS and recover all the databases.  One thing you will also need to do is add back any userids that had SSAS administrator privileges as they were held in a file on the SSAS data directory.

Wednesday, May 4, 2011

How many cubes

I am often surprised how many cubes some BI developers create. It would appear that each time they have a requirement for a piece of information, they will create a new cube.  Sometimes this is amplified because they are using denormalised summary tables, and creating new ones when they need a bit more dimensionality or a new measure, leading to a plethora of overlapping data.

Since SQL Server 2005, it is possible to put dozens of fact tables (cubes in the old days) into one cube with separate measure groups for each fact table. This is a great feature. For example, Sales and Budget have slightly different dimensionality as Sales is by cashier and hour of day, whereas, budget does not have cashier and time granularity is only available down to week.  Having these in the same cube is great, since it makes querying of sales against budget (by all the common dimensions) very easy. Also, if a user is only interested in one measure group, say sales, they can ask the browser that measure group, and they will on see the associated measures and dimensions.  In the same way they might browse a separate cube.

You might ask, are there any performance implications of having one super cube? 
  • In terms of cube size and processing overhead, the design alternatives are comparable. 
  • MDX queries can be broken down to FE (formula engine) and SE (storage engine) components.   The SE component of a query isn't materially affected by unrelated dimensions, since the storage is comparable.  However, the FE component of a query is affected by the unrelated dimensions as it is works within the entire cube space (larger with more dimensions). 
There is a LookupCube function in MDX that allows you to get the value from another cube.  This might be useful in a design that exploits multiple cubes.  But, don't see this as a panacea for multiple cubes.  It has its own performance overhead and is not as functional as having the measures in one cube.

There might also be operational considerations.  The design alternative I have discussed is having multiple cubes in the same database, but if the cubes really are unrelated, you might consider having separate SSAS databases for them.  This would lead to more operational options including, parallel processing, and even hosting databases on separate servers.

So, as a cube designer, you must weigh up the performance, functional and maintenance costs.  As an over simplified summary, on the side of mini cubes is the minimisation of FE performance costs, while on side of super cubes are increased user functionality.

For another discussion on this topic see Chris Webb's blog

Saturday, October 16, 2010

What's happening on my site?

My internet site has a series of close to real-time dashboards showing, among other things, internet activity on my site. It is primarily meant as a demonstration tool, but it has prooved useful to me in quickly seeing what's happing on my site (and my servers, since there is also a Perfmon dashboard).

Interesting, over the last couple of weeks, I have seen some suspicious looking referrers from Russia. You can probably still see them on the default dashboard on http://RichardLees.com.au/Sites/Demonstrations. See the Top Referrers table on the bottom. At the moment the top referrer includes "buy ultram.narod.ru" at the top, and there are a few more suspicious ones lower down. I am used to seeing Google, Bing or my blogspot compete for the top spot.

It's great with Microsoft PerformancePoint dashboards that you can dynamically drill down the table as an ad hoc cube browsing tool. I have drilled down to see the pages from the referrer, the http command (HEAD), the ip address, http return code etc. See picture. You can do this too, simply right click on the chart and take the direction you want. A tip; click the triangle at the top right of the chart and open in a new window to see the chart/grid on a new page.

Although this activity is suspicious, and might represent a potentially malicious attack, it doesn't appear to have had much success. Or perhaps all it wanted to do was populate my logs.

In any case, I feel that the dashboard has shown the value of processing logs and providing an easy and intuitive dashboard to this information. Everyone who has an internet site should have access to information on the site's activity. Also, many of the off-the-shelf web analytic tools only show you a subset of what is really happening. For example, I have Google Analytics, which are quite useful, although they only show me a subset of the activity, which doesn't include these referrers.


Wouldn't it be nice if Microsoft Windows included an install option that went something like


Would you like incoming http activity processed and kept in an OLAP cube for ad hoc browsing?


For more examples of online, close to real-time OLAP cubes and data mining models see http://RichardLees.com.au/sites/demonstrations

Wednesday, August 18, 2010

Write Back cubes are easy with Excel 2010

SQL Server has supported write enabled cubes for over 10 years, but things have just got a whole lot better with Excel 2010 (and SQL Server 2008). You can now browse and update a write enabled cube in Excel without any add-ins and without writing any code.

It's quite easy. Just right click on the partition (in the Partitions tab of the cube editor) and select Writeback settings. You can just take the default settings. Interestingly, the storage mode does not need to be ROLAP, so we get good performance without operational complexity.

Now, simply open Excel 2010, connect to the cube, and enable "What-If Analysis". This is a button in the Tools section (next to PivotChart and OLAP Tools). Now you can write over any of the cells in the cube. The numbers you have changed will have a little purple triangle in the bottom right corner. When you want to write these back simply click the "Publish Changes" button under the "What-If Analysis" button. Excel will "distribute" your updates according to the settings you have asked for.

Excel has a Settings button under "What-If Analysis", which allows you to control how values are spread, when you enter at a higher level than the cube granularity. For example, you could enter a number for the whole of 2010 and it will spread the amount across all periods based on whether you want an even spread and whether you want the updates to be incremented based on the old numbers.
Excel does not natively support the insertion of new dimension members, which would have been a nice feature for some applications.
Operationally, I don't think it is so important to migrate the writeback data to the main partition, since the writeback partition is typically MOLAP. However, it would not be difficult to move the data over in an SSIS package on a scheduled basis.
Of course, you can restrict read and write access rights based on roles, so, for example, the Australian users can only update the Australian numbers.

It now really is easy to set up an updateable cube and make available to users with Excel 2010.

Monday, March 29, 2010

MDX - Group by measure range dynamically

Here is a similar MDX puzzle. The aim is to aggregate members by the range their measure falls into. For example, aggregate cities into ranges (multiples of 1000) of the number of hits.
Of course, you can hand craft the MDX to define each range, but that's not elegant, scalable or flexible. How about some MDX that dynamically creates the ranges?

Here is a solution from my Weblogs database. The query is aggregating the number of hits for all cities with hits in the 0 - 999 range, 1000 - 1999 range etc. See how it uses recursive MDX, very similar to the preceding blog, which aggregates by distinct member_caption. Recursive MDX really is very useful.

Here is what the output looks like. Note; ignore the city name, that is just the last city in the range. The first measure column has the range limit, the second column has the number of cities and the third measure has the total hits for that range.


Sunday, February 14, 2010

I like PerformancePoint Dashboards

PerformancePoint (PPS) dashboards really are easy to create once you have an OLAP cube with useful information. One of my cubes, Weblogs, is continually updating with all the web activity on my site RichardLees.com.au. In a couple of days, two and a half years ago, I built some PPS dashboards as a public demonstration. I still find them very interesting and a useful guide for activity and performance on my site.

You can see the same information I can. The picture on the right, is a dashboard pointing at the weblogs cube. To get to it, just click on the Web Analytics dashboard on the left hand menu of http://RichardLees.com.au/sites/demonstrations. Then click on the Web Performance tab on the top of the dashboard. The scorecard, is asking for the last 6 days on columns and the top 20 http resource types on rows. It will continually adapt to the date and web activity. It doesn't end there, you can click on any resource type (in the picture, I have clicked on .aspx) so that the 3 right hand charts will dynamically filter to this resource type. At a glance I can see which particular resources are most active and their response time trends. From the bottom chart, it would appear that most of the .aspx resources have been progressively slowing down over the last 12 months. This might be due to the increased activity, database size growing, or perhaps my web site is competing for internet bandwidth with my boys web downloads. I'll investigate further.

The point I would like to make, is that once you have useful information in a cube, it is really quite a simple job to create some dynamic and interesting dashboards. If you are heading towards dashboards, I would encourage you to start by very loosely defining what you want on the dashboard. You only need to determine what information your cube requires. Then once, you have the cube, you can be creative with the dashboards to see how to maximise the information you have available. In my experience, what tends to happen is that you will start with a generic dashboard, then, with feedback, make more dynamic functionality so that users are able to easily drill down to the interesting aspects.

There is really only one gotcha that stands out for me and that is the client browser. Internet Explorer 7 and 8, obviously, are very good clients. Other browsers, don't support all PPS dashboard functionality. Of course, if you have a particular browser in question, you could browse to my demonstration and see how well it does. Feel free to post comments on this blog with your results.
By the way, I have similar beliefs about SQL Server Reporting Services. Once you have a cube with all the information, dynamic reporting is quite simple. Also, Reporting Services and PerformancePoint should be seen as complementary, rather than alternatives.


Saturday, January 30, 2010

Aggregations Won't Fix Cube Performance

There appears to be a temptation for SQL sales people to demonstrate the aggregation wizard with the impression that it is the tool to solve all performance issues. Unfortunately, it isn't, and I need to dispel that myth.

The aggregation design wizard is not a performance panacea, but it can help. It's like tire pressure in a racing car. The optimal pressure will help performance, but it won't turn a slow car into a fast car.

Let's think about what the aggregation wizard does. The base cube cells only contain values at the intersection of all dimension keys. When a query asks for data at a higher level, AS must derive this data from the base cells by aggregating them. The aggregation wizard determines which of these aggregations to calculate at cube processing time and store on disk. So designing aggregations will impact your cube processing time. The more aggregations you have the longer the cube processing time, and the larger the cube on disk. At query time, if AS does not have the pre-aggregated cell on disk, it will get the lower level cells (these might be aggregations too) and calculate the aggregated cell. This new aggregation will reside in AS memory like any other aggregation or base cell. So there's the rub, even if you don't have any aggregations, AS will create them at query time (or cache warming) and try and keep them in memory for subsequent queries. So, if AS is not memory constrained, aggregations will only help the queries while the cache is cold. In essence, a cube warming query (CREATE CACHE) will have a similar effect as aggregation designs for a non-memory constrained cube.

Cubes that benefit the most from aggregation design are ones that are updated frequently (for example, every minute or so during busy times) and are larger than the memory available to the AS data cache. Note, when a cube partition is processed, all the cells and aggregations in memory are dropped.

Another important note; by default, the aggregation wizard will only create aggregations on key attributes and attributes in natural hierarchies. For example, if you have a Date dimension with date as the key, the aggregation wizard by default, will only build aggregations on "date" and natural hierarchies. If these other attributes are commonly used and you would like the aggregation wizard to consider them, you can ask for it in the Aggregation Usage window (or properties in the cube design). The "Default" usage for a key is "Unrestricted", while the "Default" usage for a non-key property is "None". However, don't see this as a silver bullet, by enabling all properties as "Unrestricted"! That will only result in very thin aggregation design. Also, aggregations on keys, tend to be the most important ones, so the default options suit most cubes.

When using "Distinct Count" measure in a cube you need to be even more careful with aggregations, since each aggregation (and base cell) will include every distinct value of the Distinct Count. This can make aggregations very large and costly to build/query.

For very small non volatile cubes such as the New Zealand census cube http://EasternMining.com.au/sites/Demonstrations/Pages/NZCensus_Excel.aspx there is no benefit from aggregations, which is why that cube has no aggregations.

For really good OLAP cube performance you should ensure that the design is optimal, and use aggregation design (or usage based aggregation design) as a final operational tuning exercise.

Friday, September 25, 2009

Which cube browser for Microsoft OLAP


I am often asked which cube browser I recommend for Analysis Services cubes. The answer is typically a few minutes long, since there isn't one ubiquitous cube browser that satisfies everyone. It's a bit like asking someone which vehicle you recommend. It really depends on what the purpose is and what you value. A high performance sports car might be appropriate for some people, but would be inappropriate as a family car or to tow the boat to the coast. For me, the best vehicle is a sports bike, but this would be inappropriate for most road users. The same applies to cube browsers, some users need something very simple and easy, while others need sophistication and flexibility. Having said that if Microsoft Excel had a few more features, it could quite easily be the ubiquitous browser.

Two cube vehicles that complement each other well, unsurprisingly, are Microsoft Excel and SQL Server Reporting Services (RS). Excel is very flexible, while RS can deliver tailored reports, with flexible parameters and easy links to drill down/across to other reports.
In this way, RS is perfect for naive users that need easy to consume information with click-through for more detailed and associated information. Note; RS does not support ad hoc cube browsing. Microsoft also have PerformancePoint, which is a great tool for delivering visual data to a thin client. It has functionality somewhere in-between Excel and RS and many features not available in either. PerformancePoint supports (very rudimentary) ad hoc cube browsing, but it is very powerful at delivering visual and interactive data. So PerformancePoint is ideal for presenting visual data to naive users, and for data savvy users there can be a great deal of “data flexibility”. PerformancePoint can deliver this in a semi structured way, so that users don't drive a cube browser, rather, they drive a dashboard of their data. There is a good example of rich PerformancePoint dashboard on SQLS Live Dashboard. Notice how you can click on scorecard items, and they act as filters on the charts.

Another important cube browser (although not yet truly ad hoc) is Excel Services. Excel Services is essentially an Excel spreadsheet accessed through a thin client, Internet Explorer. Any spreadsheet can be published, even one that is attached to an OLAP cube, so it can be a useful vehicle to deliver live cube data. There are a couple of good Excel Services examples on NZ Census. Notice how you can interact with the spreadsheet by drilling down hierarchies and applying filters. Note too; how the data is live (you might want to switch to the weblogs spreadsheet). However, in the current release of Excel Services you cannot change what is on rows, columns and filters. I have many customers that love Excel Services, since it permits their Finance dept to design and publish reports entirely within Excel, and their report users always see live data.

There are hundreds, if not thousands, of third party cube browsers. They really aren't that hard to develop.
I wrote the first thin client cube browser, ThinSlicer, which is still used by many organisations. When I wrote the first version of ThinSlicer, in 1998, I thought that its shelf life would be short; surely Microsoft will offer a highly functional, low cost, thin client cube browser? How wrong could I be? It is now 10 years on, and the only ad hoc thin client cube browser we have from Microsoft is PerformancePoint, which while it has an ad hoc cube browser, it is not the reason anyone would buy it. An example of a more functional thin client cube browser would be Report Portal. This product supports quite strong ad hoc cube browsing and charting. I must add that there are many other commercial cube browsers, and I really don’t want to list them, since the list and relative strengths are continually changing.

If you are embarking on a data warehouse or business intelligence project, I would encourage you to leave the cube browser choice until quite late in the process. (Just like you shouldn't purchase your production hardware until you are almost ready to deploy a solution.) This is particularly true if you are not familiar with cubes and are not sure what you and your users will need. Microsoft’s SQL Server is probably the best foundation for a data warehouse/business intelligence solution. Particularly its OLAP cube and related technologies such as data mining. I would encourage you to use Excel 2007 and Reporting Services (which is free with any version of SQL Server) as the initial cube delivery vehicles, and trial other products when, and if, you find the need. If you are looking for better thin client visualisation, do try PerformancePoint and Excel Services before you engage with third party vendors. These products are very useful, and they are likely to be greatly improved in future versions. I should add that PerformancePoint dashboards will be incorporated into SharePoint MOSS in future, which makes a lot of sense to me. One other consideration, if you are delivering to users outside of your Intranet/internal network is licensing. SQL Server RS and Excel are quite easy to licence for use over the Internet. Unfortunately, it’s not so easy with PerformancePoint and Excel Services. If that is what you would like to do, I suggest you talk to your Microsoft reseller early on.

Friday, June 26, 2009

Reporting Services Tips for OLAP Cubes

Naturally I have an inclination to use Reporting Services on OLAP cubes. My feeling is that reports should by and large be run from OLAP cube where they can be dynamic and fast. SQL based reports are more ideally suited for "atomic data" reports (eg transaction lists) and some special reports requiring real time data.

There are a few funnies when you get into OLAP reports with SSRS. The SSRS wizard does a great job of starting the report and building the parameters you need. However, before long you will need to edit the MDX that the wizard creates, to do things like taylor the parameter queries for cascading filters. Here are a couple of tricks that I commonly use.

In SSRS 2008, when you edit any MDX query, the designer will automatically rebuild (in other words wash out any MDX changes you have made) input parameter queries. The simple work around for this frustrating behaviour is to remove the Dimension and Hierarchy values from the query's parameter list.

You might want to use the SSRS calendar control for easy date picking, which is used to filter an OLAP date dimension. This isn't handled automatically, but can be achieved with the following. Change the parameter property to be Date/Time datatype. That will ensure that SSRS uses the date picker. For most reports you will want to dynamically specify the default. This can be simply achieved by a single row OLAP query (for example the last day with data) or from today's date using the now() function. If you use the now() function you can strip off the time with =cdate(format(now(),"yyyy-MM-dd")). The trick now is to use the datetime parameter in your MDX query. What you need to do is construct a full member name using the known dimension-hierarchy names and contruct the member key using the date. The construction of the key will depend on what you have defined as the key of the date hierarchy. If the key is a date, then the fully qualified member name will look something like this. [Date].[Calendar].[TheDate].&[2009-06-26T00:00:00]. So to include the date parameter in your query you can include something like the following in your query strtomember("[Date].[Calendar].[TheDate].&["+format(now(),"yyyy-MM-dd")+"T00:00:00]") Just replace [Date] [Calendar] and [TheDate] with the dimension, hierarchy and level name from your dimension. The MDX query tool in SQL Enterprise Manager will help by providing a sample member. The date parameter might simply be used in the WHERE clause to filter the query or it might be part of a range specification etc. It's a member specification and as such could be used anywhere in your query.

Not so much of a tip, but more of an apology. The MDX query editor in SSRS is a very poor text editor. When I am editing an MDX query, I invariably cut and paste the query into and out of SQL Enterprise Manager Query tool.

Here is an easy way to get a report line number. =RunningValue(1, SUM, "Invoice_Data") The line number can also be used for alternate line shading.

Check the performance of all the MDX queries. If any of them are not running fast enough, see if there is anything you can do to speed them up. One classic way to improve performance and improve report usability is to filter out empty members.

Another classic way to improve performance is to change the use of any single select parameters from StrToSet() to StrToMember() and placed on the WHERE clause.

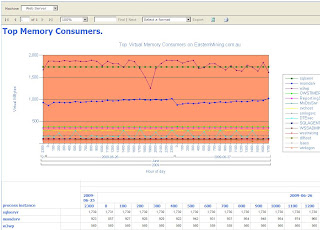
Just like SQL reports. Or perhaps more so, since OLAP reports are more likely to be run dynamically, link your reports together so that users can easily navigate down and across reports. Essentially, making it easier for users to drill through to focus the salient data. With SSRS reports on OLAP this can be achieved in such a way that users do not need to know anything about databases or even that a cube is behind the report. They simply click on headings or numbers to drill into and across the data that interests them. For example, click on the "Top Memory Consumers" picture above for an OLAP report. The report is dynamic and close to real time. Notice how you can click on any of the processes and get an analysis of that process. Likewise, you can click on any of the counters in that report for a breakdown of the processes using that resource. A good set of dynamic SSRS reports will appear more like an application to end users than a traditional list of static reports.

One last tip is to verify that all the queries in your report definition are actually used. Sometimes SSRS will create new queries for you when you edit parameters. Or you might modify a report and remove a parameter. Do remember to take out the unused queries. All queries appear to fire even if they aren't used.

For examples of real time OLAP reports see http://RichardLees.com.au/Sites/Demonstrations

Saturday, June 6, 2009

Resizing .jpg files for SharePoint Server 2007

My internet site (http://richardlees.com.au/) is hosted on Sharepoint Server 2007. There are many photos on my site, particularly, but not exclusively, family snaps. In SharePoint I have resized the photos for easier display. I knew that SharePoint did not physically resize the images, but didn't appreciate the full impact it had on people browsing my site over a low speed link. Since SharePoint did not physically resize the photo (.jpg file) a 2MB file might be downloaded to show a little photo whose image only needs to be a few kilobytes. I am a bit disappointed that Sharepoint doesn't resize images automatically. I kind of feel that since it knows how big the display images are, it could resize them accordingly, and even though it didn't do it now, I thought it must be fixed in a service pack or subsequent release.

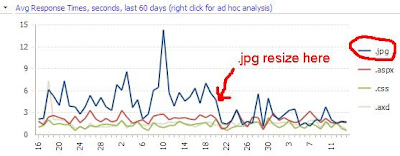
Anyway a couple of weeks ago a partner colleague mentioned to me his frustration with these images, so I spent a few minutes and resized all the .jpg images in SharePoint. I was only using about 30 images, so it only took about 30 minutes. It is interesting how much difference this has made to the performance of my web site. The home page on my web dashboard shows average response times for the major file types (.aspx, .axd, .css, and .jpg) over the last 60 days. If you look at this graph (top right on http://RichardLees.com.au/Sites/Demonstrations) you will see .jpg has dropped in response time around May 21. Althought there is quite a lot of daily variations since it is an average of many different size images. I haven't had such a large performance change since I talked to my son about his download activity (http://richardlees.blogspot.com/2009/01/is-my-web-site-getting-slower.html).

You are able to drill into the response time graph, and even take it to a new window if you know how to drive PerformancePoint (see http://richardlees.blogspot.com/2009/04/try-out-microsofts-zero-footprint-cube.html for some quick instructions). I have done this, and drilled down to the photo of Anna and myself on unicycles (one of the main MB culprits). The graph is attached. You can achieve the same, although you will see a more up to date chart since the cube is updating every few minutes.

Two takeaways from this initiative.
  1. If you are using SharePoint 2007, it pays to resize your images to the display size.
  2. It always pays to monitor and log performance of any production application so that you can see user performance and the impact of your tuning exercises
For more close to real-time performance information of my internet site and the two servers behind the site goto http://RichardLees.com.au/Sites/Demonstrations